
2,095 people in Cheltenham were on unemployment benefits in August, 2.7% of 16 to 64s. Hesters Way is highest at 5.6%; all 20 wards, by age and trend.
The Cheltenham claimant count stood at 2,095 in August, according to figures published by the Office for National Statistics on 15 September. That is 2.7 per cent of residents aged 16 to 64. It has barely moved from July’s 2,100.
So the number of people on benefits in Cheltenham because they are out of work, or on low pay and required to look for more, is 2,095. Four wards in the west and north of the town account for two in five of them, as the ward table below shows.
The headline has been almost flat for a year. Underneath it, two age groups are moving in opposite directions.
How many people in Cheltenham are on benefits?
If you want one number for how many people in Cheltenham are on benefits, 2,095 is the number that gets quoted, and it is the right one for unemployment. It is not the total number of residents receiving any benefit, and the gap between the two is large.
The claimant count records people claiming benefit principally because they are unemployed. Under Universal Credit that means claimants placed in the conditionality groups that require them to look for work, which covers people with no job at all and people working on low earnings who are still expected to find more hours. Everyone else on Universal Credit is outside it: claimants with no work requirements because of a health condition or disability, those preparing for work, carers, and people working enough hours to be free of requirements.
It also leaves out benefits that have nothing to do with job search. Pensioners drawing the State Pension or Pension Credit are not counted. Neither is anyone receiving Personal Independence Payment, Attendance Allowance, Carer’s Allowance, Child Benefit or the borough council’s council tax support, and a household can be on several of those at once while nobody in it appears in the 2,095.
That is why the claimant count and the unemployment rate are different numbers too, and why the claimant count is the higher of the two. Cheltenham’s 2.7 per cent is a share of the 16 to 64 population, not of the workforce.
The only comparable monthly figure published for a district the size of Cheltenham is the claimant count itself. The wider Universal Credit caseload is published by the Department for Work and Pensions through Stat-Xplore rather than monthly through ONS, so there is no equivalent local number updated on the same schedule.
The over-50s are rising while the middle band falls
Compared with August 2025:
- 50 and over: 505, up 40. The over-50s have not been above this level since February 2022, and August is only the third month since then to reach it, after February 2025 and June 2026.
- 25 to 49: 1,200, down 70. This is the band that drove last winter’s fall, and it is still falling.
- 16 to 24: 385, unchanged. Youth claims have sat between 375 and 405 every month for the past year.
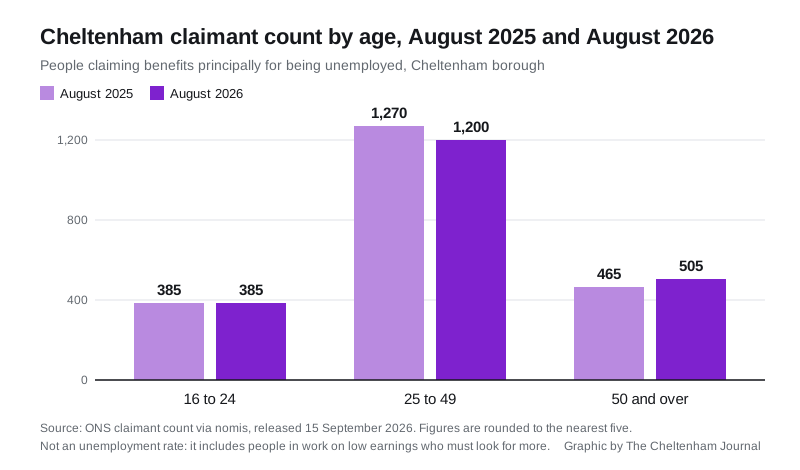
The bands are rounded to the nearest five and do not always sum exactly to the total.
Number of people on benefits in Cheltenham, ward by ward
ONS publishes the claimant count for each of Cheltenham’s 20 borough wards. We pulled the August 2026 figures from nomis on 4 October 2026. They sum to 2,090, five short of the borough total, because every ward figure is rounded to the nearest five.
| Ward | Claimants, Aug 2026 | Share of 16 to 64s |
|---|---|---|
| Hesters Way | 255 | 5.6% |
| St Paul’s | 240 | 4.7% |
| Oakley | 200 | 5.3% |
| Springbank | 160 | 3.7% |
| St Peter’s | 150 | 3.2% |
| St Mark’s | 145 | 3.5% |
| Lansdown | 130 | 2.8% |
| Swindon Village | 105 | 3.5% |
| College | 100 | 2.7% |
| All Saints | 85 | 2.1% |
| Pittville | 80 | 1.9% |
| Benhall, the Reddings & Fiddler’s Green | 60 | 1.6% |
| Up Hatherley | 60 | 1.6% |
| Battledown | 60 | 1.5% |
| Warden Hill | 55 | 1.8% |
| Park | 55 | 1.7% |
| Charlton Park | 40 | 1.4% |
| Charlton Kings | 40 | 1.1% |
| Leckhampton | 35 | 1.1% |
| Prestbury | 35 | 1.1% |
The pattern is stark. Hesters Way (255), St Paul’s (240), Oakley (200) and Springbank (160) together hold 855 claimants, 41 per cent of the borough’s total, in four of its 20 wards. Hesters Way’s rate of 5.6 per cent is five times Leckhampton’s, Charlton Kings’ and Prestbury’s 1.1 per cent, which have just 35 to 40 claimants each.
Two cautions. Ward rates are small numbers, so a change of five people moves a ward’s rate noticeably from month to month. And the current ward boundaries are new enough that nomis returns no figures for them a year ago, so ward-level change over the year cannot yet be measured on a like-for-like basis. Gloucestershire County Council’s monthly unemployment bulletin also names Hesters Way as the borough’s highest claiming ward.
How Cheltenham compares in Gloucestershire
Cheltenham has the second highest rate and the second largest number of claimants of the county’s six districts, in both cases behind Gloucester.
| District | Claimants, Aug 2026 | Share of 16 to 64s |
|---|---|---|
| Gloucester | 3,150 | 3.5% |
| Cheltenham | 2,095 | 2.7% |
| Forest of Dean | 1,375 | 2.6% |
| Tewkesbury | 1,425 | 2.4% |
| Cotswold | 1,090 | 2.1% |
| Stroud | 1,595 | 2.1% |
Cheltenham’s 2.7 per cent matches the Gloucestershire average exactly. Both sit well below England on 4.0 per cent and the United Kingdom on 3.9 per cent.
The longer view
The claimant count in Cheltenham is well down from the pandemic, when it reached 3,955 in August 2020. It has not returned to where it started. In February 2020, the last full month before the first lockdown, 1,635 people were claiming in the borough. August’s 2,095 is 460 higher, a rise of 28 per cent over six and a half years.
The recent direction is gently downwards. August 2024 was 2,205 and August 2025 was 2,120.
Within this year the path has been flat rather than falling. The count was 2,130 in May, 2,140 in June, 2,100 in July and 2,095 in August. The lowest month in the past two years was December 2025 and January 2026, both on 1,990. Every month since has been higher.
Two things the number does not mean
It is not the unemployment rate. The claimant count records people claiming benefits principally because they are unemployed. Since Universal Credit, that also includes people who are in work but on low earnings and still required to look for more. It will therefore be higher than the unemployment rate for the same area.
The local figures are experimental. ONS labels the local authority claimant count as official statistics in development, and revises recent months. The next monthly release, covering September, is due on 20 October 2026.
What it means for you
- The only age group growing in Cheltenham is people aged 50 and over. Claims themselves are handled by the Department for Work and Pensions, not the borough council.
- Council tax support is administered by the borough council, not the DWP. Our Cheltenham council tax bands page sets out what each band costs in 2026/27 and which area you are charged under.
- If you are weighing up a move, our Cheltenham house prices page tracks the Land Registry average for the borough and how it compares with Tewkesbury, Gloucester and the Cotswolds.
Frequently asked questions
How many people in Cheltenham are on benefits?
2,095 in August 2026 on the claimant count, the monthly measure of people claiming benefit principally because they are unemployed. That is 2.7 per cent of residents aged 16 to 64. It does not include pensioners, carers, people on health-related Universal Credit or anyone on PIP or Child Benefit.
Which part of Cheltenham has the most people on benefits?
Hesters Way, with 255 claimants in August 2026, 5.6 per cent of its 16 to 64s. St Paul’s (240) and Oakley (200, 5.3 per cent) are next. Leckhampton, Charlton Kings and Prestbury have the lowest rates, all 1.1 per cent.
Is the Cheltenham claimant count going up or down?
Down slightly over the year, flat within it. August 2026 was 2,095 against 2,120 a year earlier and 2,205 in August 2024. Within 2026 the count has run 2,130 in May, 2,140 in June, 2,100 in July and 2,095 in August, so it has stopped falling.
Which age group in Cheltenham is rising?
People aged 50 and over, up 40 over the year to 505. The 25 to 49 band fell 70 to 1,200 and the 16 to 24 band was unchanged at 385.
How does Cheltenham compare with the rest of Gloucestershire?
Second highest of the six districts, on both the rate and the headline number, behind Gloucester on 3.5 per cent and 3,150 claimants. Cheltenham’s 2.7 per cent is the county average and is below England on 4.0 per cent.
When is the next figure published?
20 October 2026, covering September. ONS treats the local authority claimant count as official statistics in development and revises recent months, so earlier figures can move.
Figures in this article come from the ONS claimant count series published through nomis, for the local authority district of Cheltenham, geography code E07000078.
Have your say